Tech FAQ: How does CRIS predict storm outages, damage, and resource allocation?
We get lots of questions from potential customers. When we get the same question often enough, we create a brief explainer as a reference tool for our internal teams as well as interested visitors to our website. Here’s one about “CRIS,” the AiDASH Climate Risk Intelligence System™.
Dealing with storms and the damage thereafter is a fact of life for utilities. But what if you could predict where a storm will land, its severity, and its probable impact on your T&D lines? You’d be far better able to prepare the right resources for the right locations ahead of time — and keep your customers informed.
That’s why we created AiDASH Climate Risk Intelligence System™ (CRIS). The AI-powered system helps utilities and other organizations predict storm and wildfire incidents before storms hit. That in turn enables them to restore any outages faster and more safely, and communicate with customers more proactively and accurately.
At a glance: How does CRIS work?
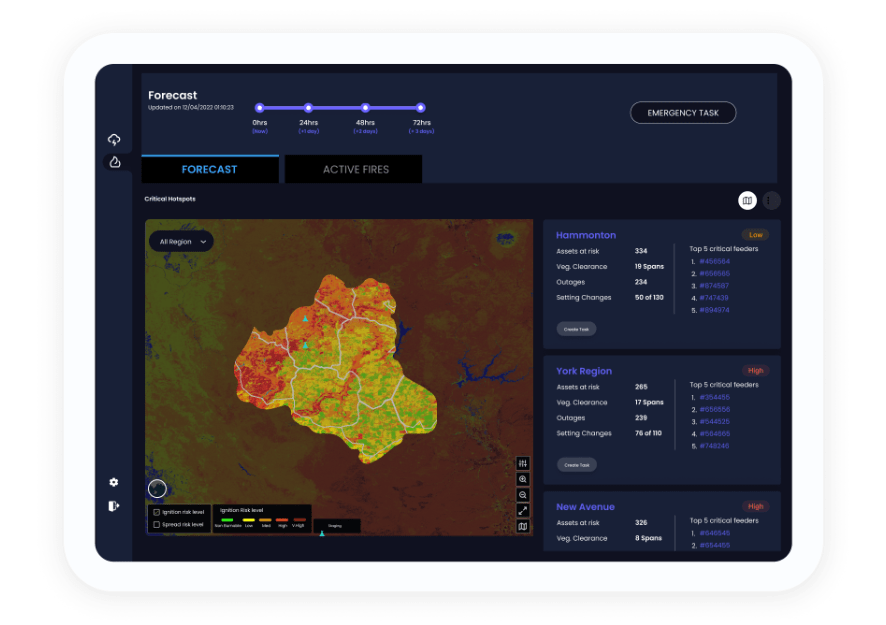
CRIS fuses satellite imagery, real-time weather data, vegetation data, and historic outage and resource usage data to give you insights before, during, and after a major weather event.
Here are answers to some common questions we get about how the system works:
- CRIS models predict various types of precipitation and their potential impacts.
- CRIS typically requires up to 10 years of historical data to effectively predict incidents.
- We take new satellite imagery for CRIS multiple times each year.
- CRIS maintains up-to-date data on utility assets by integrating directly with utility databases and servers.
- CRIS’ dashboard is a proprietary system we developed in-house specifically for CRIS, but we can easily facilitate integration with third-party systems like ESRI.
- Our AI leverages several critical data types to generate accurate predictions and actionable insights, like vegetation condition, outage history, and weather data. (See here for more details.)
- Utilities can customize thresholds like storm categories and severities so the system’s alerts and responses align with their specific operational and regional needs.
- CRIS primarily uses restoration time as a metric to evaluate improvements in system resiliency.
- CRIS is designed to tackle the increasing variability and frequency of extreme weather events.
Dive deeper
Q: Do you have models for different precipitation types such as rain, snow, or freezing rain?
A: Yes, CRIS is equipped with models designed to accurately predict various types of precipitation and their potential impacts. Each type of storm or precipitation event — be it rain, snow, hail, or freezing rain — has distinct characteristics and poses different risks. Our system considers all of these factors.
Q: How many years of historical data does your system need to offer predictions?
A: We typically require up to 10 years of historical data to effectively predict incidents. This allows the system to capture a comprehensive range of weather events and their impact.
This long span of data is crucial because it includes a variety of weather conditions across multiple seasons and years. By incorporating seasonal variations, weather extremes, and long-term climatic trends, we can refine the predictive accuracy of our models.
Q: How often do you take satellite imagery?
A: We acquire very high-resolution satellite imagery multiple times each year. Typically, we run scans at least annually to identify vegetation that could potentially cause outages by encroaching on utility assets. Additionally, following significant storm events, we acquire extra imagery to ensure that our customers can promptly address any changes in vegetation.
We also obtain medium-resolution (1-30 meters) satellite images on a bi-weekly basis. These images are integral to our ongoing monitoring efforts because they provide vital data on vegetation health, soil moisture conditions, and land surface temperatures.
Q: How does CRIS stay current with changes in T&D lines and capacity ratings between storms?
A: CRIS maintains up-to-date data on utility assets by integrating directly with utility databases and servers. This integration ensures regular updates to our system to capture changes in the infrastructure.
Q: Is this dashboard/interface ESRI-based?
A: No, our dashboard/interface is not ESRI-based. It’s a proprietary system we developed in-house specifically for CRIS. The interface is tailored to meet the specific needs of our customers and offers unique tools and analytics that we optimized for managing storm and wildfire events.
However, if you need to integrate CRIS data or insights with third-party systems such as ESRI, we can easily facilitate that integration.
Q: What critical data does CRIS use to develop predictions?
A: Our AI leverages several critical data types to generate accurate predictions and actionable insights. These include vegetation condition, outage history, weather data, and asset data (eg, age, material, and condition).
Plus, we designed our AI models to continuously learn from multiple data streams, enhancing their predictive accuracy over time. With a greater diversity of data types, CRIS’ predictions become more accurate and refined.
For more detailed information about CRIS data sources, check out this article: Tech FAQ: What data inputs does CRIS use?
Q: Does CRIS allow utilities to configure things like storm categories and severities?
A: Yes. This feature is particularly valuable because it enables utilities to tailor the system’s alerts and responses to their specific operational and regional needs.
For example, you can set different thresholds for storm and outage categories that determine what triggers an alert or what specific responses utilities should initiate.
Q: What metric does CRIS use to evaluate improvements in resiliency?
A: CRIS primarily uses restoration time as a metric to evaluate improvements in system resiliency. Shorter restoration times indicate a more resilient infrastructure and effective pre-storm planning and post-storm responses.
Q: Given the effects of climate change, how does your modeling account for increasingly variable factors?
A: CRIS is designed to tackle the increasing variability and frequency of extreme weather events. Here’s how it addresses these complexities:
- High-resolution data inputs: Utilizes high-resolution satellite imagery, environmental and weather station data, and detailed historical data to identify subtle patterns and emerging risks.
- Continuous learning: Machine learning algorithms continuously integrate new data, improving predictive accuracy as weather patterns evolve.
- Scenario analysis: Allows operators to input actual ground conditions, enabling data-driven decisions without relying on gut feelings or experienced employee insights. CRIS recalculates potential impacts based on real data, ensuring accurate resource needs and enhanced operational preparedness even if forecasted weather conditions don’t materialize.
- Early warning systems: Integrates real-time data and predictive modeling to offer early warnings for extreme weather events, enabling proactive measures.
- Collaboration with experts: Collaborates with climate scientists and meteorological experts to ensure models are updated with the latest research, enhancing the prediction of rare events.
Check out this customer story to learn more about how CRIS helps utilities with their storm impact planning.
Click here for more information about our Climate Risk Intelligence System™ (CRIS).
AiDASH is the leader in Intelligent Vegetation Management
Ready to see it in action for yourself?
Get a demo today.
The best collection of tools, tips, guides, and industry stories – straight to your inbox.
Subscribe to our newsletter