Understanding the basics of geospatial data using python
The word ‘Geospatial’ indicates that data has some Geographic component to it. For us humans, it means the Earth’s surface, anywhere on the globe. It can be a city’s map, its street lines, junctions, or your address. This data comes with endless possibilities and once you get access to the Geospatial data, you can do mapping (of roads, canals, train routes, etc.), disaster management (flood / wild-fire damage estimation, etc.), and much more.
In this blog, we will introduce you to the basics of common Geospatial data formats. We will also look at some Python modules that can help you in getting started with Geospatial data.
Geospatial data primarily comes in two data formats:
Raster Data format
Represents data as a cell or a grid matrix. E.g., jpeg, GeoTiff, etc.
- GeoTIFF: A GeoTIFF is a public domain metadata standard that has the geo-referencing information embedded within the image file
Vector Data format
Uses X & Y coordinates to represent locations. E.g., Shapefiles, GeoJSON, KLML, etc.
- Shapefile: A shapefile is a simple, nontopological format for storing the geometric location and attribute information of geographic features
- GeoJSON: GeoJSON is a format for encoding a variety of geographic data structures
In this blog, we will cover some basic modules to read, process and visualize the aforementioned data formats
Required modules:
- GeoPandas
- Contextily
- Rasterio
Working with Vector Data formats
GeoJSON is simply a JSON file, which conforms to the community-defined standards (https://geojson.org/). Although we can simply use JSON module to read its content, we will use GeoPandas, which supports loading of shapefiles in a similar manner:
A vector data format supports the following types of geometries:
- Point: Represents a discrete data/location on the map. Church, Place names, etc.
- LineString: Represents linear features. Street, Electric line, etc.
- Polygon: Represents areas. City, Forest, etc.
- MultiPoint, MultiLineString, MultiPolygon: List of corresponding geometry types
*You can load a shapefile (.shp file) with the same syntax, you will see a similar data frame. We will be working with Philadelphia datasets

GeoPandas automatically extracts the Coordinate Reference System for your data and is available as the data frame attribute crs.

Visualizing the data:

In itself, the plot might not make much sense. So let’s plot it on the World Map. For this, we will need to convert our data to EPSG:3857, Spherical Mercator projection coordinate system.

The blue lines represent the streets, the red patches represent tobacco-free zones and the green dots represent the nearest fire stations in Philadelphia.
Working with Raster Data Format
Geospatial data in raster format comes in GeoTiff files. We can use the Rasterio module to load these files in Python.

Rasterio also reads the raster properties:

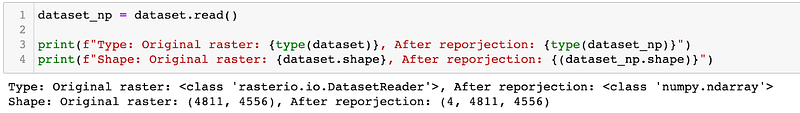
A typical GeoTIFF data comes with 4 bands: Red, Green, Blue and NIR (Near-Infrared)

If you want to transform the raster more freely, you can simply convert the raster into a NumPy array with 4 channels:
References:
- https://www.gislounge.com/what-is-a-geotiff/
- https://desktop.arcgis.com/en/arcmap/10.3/manage-data/shapefiles/what-is-a-shapefile.htm
- https://geojson.org
- https://www.geosearch.com/employer-blog/gis-vs-geospatial#:~:text=The%20word%20geospatial%20is%20used,a%20form%20of%20geospatial%20data